amibroker

HomeKnowledge Base

How to convert from bar-value to pixel co-ordinates

NOTE: This article describes old method of using bar/value coordinates. New code should use GfxSetCoordsMode which allows you to use bar/value without any extra calculations.

Sometimes when using low-level graphics functions it is needed to convert from bar number to pixel X co-ordinate and from price level to pixel Y co-ordinate. Converting between them needs knowing visible bar range, Y-axis value range and pixel dimensions of drawing area. Once these params are known it is just a matter of performing simple scale transformation. The code example below shows how to do that.

function GetVisibleBarCount()
{
 
lvb Status("lastvisiblebar");
 
fvb Status("firstvisiblebar"); 

 return 
MinLvb fvbBarCount fvb );


function 
GfxConvertBarToPixelXbar )
{
 
lvb Status("lastvisiblebar");
 
fvb Status("firstvisiblebar");
 
pxchartleft Status("pxchartleft");
 
pxchartwidth Status("pxchartwidth"); 

 return 
pxchartleft bar  pxchartwidth / ( Lvb fvb );


function 
GfxConvertValueToPixelYValue )
{
 
local MinyMaxypxchartbottompxchartheight

 
Miny Status("axisminy");
 
Maxy Status("axismaxy"); 

 
pxchartbottom Status("pxchartbottom");
 
pxchartheight Status("pxchartheight"); 

 return 
pxchartbottom floor0.5 + ( Value Miny ) * pxchartheight/ ( Maxy Miny ) );


Plot(C"Price"colorBlackstyleHistogram ); 

GfxSetOverlayMode(0);
GfxSelectSolidBrushcolorRed );
GfxSelectPencolorRed ); 

AllVisibleBars GetVisibleBarCount();
fvb Status("firstvisiblebar"); 

for( 
0AllVisibleBars i++ ) 

  
GfxConvertBarToPixelX); 
  
GfxConvertValueToPixelYCfvb ] ); 

  
GfxRectanglex-1y-12y+); 


RequestTimedRefresh(1); // ensure 1 sec refres

Note that when chart scale changes, it will usually require one extra refresh to get low-level graphics alignment to new scale. That’s why we added RequestTimedRefresh call at the end.

QuickAFL facts

QuickAFL(tm) is a feature that allows faster AFL calculation under certain conditions. Initially (since 2003) it was available for indicators only, as of version 5.14+ it is available in Automatic Analysis too.

Initially the idea was to allow faster chart redraws through calculating AFL formula only for that part which is visible on the chart. In a similar manner, automatic analysis window can use subset of available quotations to calculate AFL, if selected “range” parameter is less than “All quotations”.

So, in short QuickAFL works so it calculates only part of the array that is currently visible (indicator) or within selected range (Automatic Analysis).

Your formulas, under QuickAFL, may or may NOT use all data bars available, but only visible (or “in-range”) bars (plus some extra to ensure calculation of used indicators), so when you are using Close[ 0 ] it represents not first bar in entire data set but first bar in array currently used (which is just a bit longer than visible, or ‘in-range’ area).

The QuickAFL is designed to be transparent, i.e. do not require any changes to the formulas you are using. To achieve this goal, AmiBroker in the first execution of given formula “learns” how many bars are really needed to calculate it correctly.

To find out the number of bars required to calculate formula AmiBroker internally uses two variables ‘backward ref’ and ‘forward ref’.

‘backward ref’ describes how many PREVIOUS bars are needed to calculate the value for today, and ‘forward ref’ tells how many FUTURE bars are needed to calculate value for today.

If these numbers are known, during execution of given formula AmiBroker takes FIRST visible (or in-range) bar and subtracts ‘backward ref” and takes LAST visible (or in-range) bar and adds ‘forward ref’ to calculate first and last bar needed for calculation of the formula.

Now, how does AmiBroker know a correct “backward ref” and “forward ref” for the entire formula?
Well, every AmiBroker’s built-in function is written so that it knows its own requirements and adds them to global “backward ref” and “forward ref” each time given function is called from your formula.

The whole process starts with setting initial BackwardRef to 30 and ForwardRef to zero. These initial values are used to give “safety margin” for simple loops/scripts.

Next, when parser scans the formula like this:

Buy Ref MAC40 ), -)

it analyses it and “sees” the MA with parameter 40. It knows that simple moving average of period 40 requires 40 past bars and zero future bars to calculate correctly so it does the following (all internally):

BackwardRef BackwardRef 40;
ForwardRef ForwardRef 0

So now, the value of BackwardRef will be 70 (40+30(initial)), and ForwardRef will be zero.

Next the parser sees Ref( .., -1 );

It knows that Ref with shift of -1 requires 1 past bar and zero future bars so it “accumulates” requirements this way:

BackwardRef BackwardRef 1;
ForwardRef ForwardRef 0

So it ends up with:

BackwardRef 71;
ForwardRef 0

The BackwardRef and ForwardRef numbers are displayed by AFL Editor’s Tools->Check and Profile as well as on charts when “Display chart timing” is selected in the preferences.

If you use Check and Profile tool, it will tell you that the formula

Buy Ref MAC40 ), -)

requires 71 past bars and 0 future bars.

You can modify it to

Buy Ref MAC50 ), -)

and it will tell you that it requires 82 past bars (30+50+2) and zero future bars.

If you modify it to

Buy Ref MAC50 ), )

It will tell you that it needs 80 past bars (30+50) and ONE future bar (from Ref).

Thanks to that your formula will use 80 bars prior to first visible (or in-range) bar leading to correct calculation result, while improving the speed of execution by not using bars preceding required ones.

IMPORTANT NOTES

It is very important to understand, that the above estimate requirements while fairly conservative,
and working fine in majority of cases, may NOT give you identical results with QuickAFL enabled, if your formulas use:
a) JScript/VBScript scripting
b) for/while/do loops using more than 30 past bars
c) any functions from external indicator DLLs
d) certain functions that use recursive calculation such as very long exponential averages or TimeFrame functions with much higher intervals than base interval

In these cases, you may need to use SetBarsRequired() function to set initial requirements to value higher than default 30. For example, by placing

SetBarsRequired1000)

at the TOP of your formula you are telling AmiBroker to add 1000 bars PRIOR to first visible (or in-range) bar to ensure more data to stabilise indicators.

You can also effectively turn OFF QuickAFL by adding:

SetBarsRequiredsbrAllsbrAll )

at the top of your formula. It tells AmiBroker to use ALL bars all the time.

It is also worth noting that certain functions like cumulative sum (Cum()) by default request ALL past bars to guarantee the same results when QuickAFL is enabled. But when using such a function, you may or may NOT want to use all bars. So SetBarsRequired() gives you also ability to DECREASE the requirements of formula. This is done by placing SetBarsRequired at the END of your formula, as any call to SetBarsRequired effectively overwrites previously calculated estimate. So
if you write

Cum);
SetBarsRequired1000); // use 1000 past bars DESPITE using Cum(

You may force AmiBroker to use only 1000 bars prior first visible even though Cum() by itself would require all bars.

It is also worth noting that when QuickAFL is used, BarIndex() function does NOT represent elements of the AFL array, but rather the indexes of ENTIRE quotation array. With QuickAFL turned on, an AFL array is usually shorter than quotation array, as illustrated in this picture:
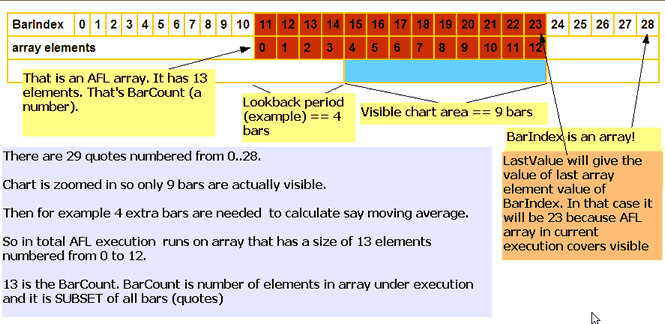
QuickAFL, BarIndex and BarCount

SPECIAL CASE: AddToComposite function

Since AddToComposite creates artificial stock data it is desirable that it works the same regardless of how many ‘visible’ bars there are or how many bars are needed by other parts of the formula.

For this reason internally AddToComposite does this:

SetBarsRequiredsbrAllsbrAll )

which effectivelly means “use all available bars” for the formula. AddToComposite function simply tells the AFL engine to use all available bars (from the very first to the very last) regardless of how formula looks like. This is to ensure that AddToComposite updates ALL bars of the composite

The side-effect is that “Check And Profile” feature will see that it needs to reference future bars and display a warning even though this is false alert because AddToComposite itself has no impact on trading system at all.

Now why this shows only when flag atcFlagEnableInBacktest is on ??
It is simple: this is so because it means that AddToComposite is ACTIVE in BACKTEST.
http://www.amibroker.com/guide/afl/afl_view.php?name=ADDTOCOMPOSITE

Since “Check And Profile” uses “BACKTEST” state you get such result.

If atcFlagEnableInBacktest is not specified AddToComposite is not enabled in Backtest and hence does not affect calculation of BackwardRef and ForwardRef during “Check And Profile”.

BACKWARD COMPATIBILITY NOTES

a) QuickAFL is available in Automatic Analysis in version 5.14.0 or higher
b) sbrAll constant is available in Automatic Analysis in version 5.14.0 or higher. If you are using older versions you should use numeric constant of: 1000000 instead.

Big symbol text in the background

Recently I heard the suggestion to add a security symbol written in big letters in the chart background. Well, actually it is pretty simple to do using low-level gfx. Just add this code sniplet anywhere in your chart formula.

GfxSetOverlayMode(1);
GfxSelectFont("Tahoma"Status("pxheight")/);
GfxSetTextAlign);// center alignment
GfxSetTextColorColorRGB200200200 ) );
GfxSetBkMode(1); // transparent
GfxTextOutName(), Status("pxwidth")/2Status("pxheight")/12 )

UPDATE: I have added transparent mode, so it works fine on non-white backgrounds too.

Low-level gfx example: Yearly/monthly profit chart

The code below is an little bit more complex example of Low Level Graphics functions (see http://www.amibroker.com/guide/a_lowlevelgfx.html)

It allows to display three kinds of charts:

  1. yearly/monthly profit table
  2. yearly profit bar chart
  3. average monthly profit bar chart

The type of chart is switchable from Parameters dialog.

It should be applied to ~~~EQUITY – portfolio equity symbol (so it only produces output if you run backtest before using it).


SetBarsRequired(1000000,1000000);
eq Foreign("~~~EQUITY""C" );

yr Year();
mo Month();

YearChange yr != Refyr, -);
MonChange mo != Refmo, -);

FirstYr 0;
LastYr 0;

startbar 0;

////////////////////////////
// SKIP non-trading bars
////////////////////////////
for( 0BarCounti++ )
{
  if( 
eq] )
  {
    
startbar i;
    break;
  } 
}

////////////////////////////
// collect yearly / monthly changes in equity
// into dynamic variables
////////////////////////////

LastYrValue eqstartbar  ];
LastMoValue eqstartbar  ];

MaxYrProfit MinYrProfit 0;
MaxMoProfit MinMoProfit 0;

for( 
startbar 1BarCounti++ )
{
  if( 
YearChange] || == BarCount )
  {
    
Chg 100 * ( -eq] / LastYrValue );
    
VarSet("ChgYear"yr], Chg );

    
MaxYrProfit MaxMaxYrProfitChg );
    
MinYrProfit MinMinYrProfitChg );

    if( 
FirstYr == FirstYr yr];
    
LastYr yr];

    
LastYrValue eq];
  }

  if( 
MonChange ] || == BarCount )
  {
    
mon mo];

    
Chg 100 * ( -eq] / LastMoValue );

    
VarSet("ChgMon" yr] + "-" monChg );
    
VarSet("SumChgMon"monChg NzVarGet("SumChgMon"mon ) ) );
    
VarSet("SumMon" monNzVarGet("SumMon"mon ) ) );
 
    
MaxMoProfit MaxMaxMoProfitChg );
    
MinMoProfit MinMinMoProfitChg );

    
LastMoValue eq];
  }
}

/////////////////////////////////////////////////
// Drawing code & helper functions
////////////////////////////////////////////////

GfxSetOverlayMode);

CellHeight = (Status("pxheight")-1)/(LastYr FirstYr ); 
CellWidth = (Status("pxwidth")-1)/14
GfxSelectFont"Tahoma"8.5 ); 

GfxSetBkMode);

function 
PrintInCellstringrowCol 
{
 
Color =  ColorRGBIIfrow == || col == || col == 13220255 ), 255IIfrow 2255220 ) );
 
GfxSelectSolidBrushColor   );
 
GfxRectangleCol CellWidth
                    
row CellHeight, (Col ) * CellWidth 1
                    (
row ) * CellHeight  1); 
 
GfxDrawTextstringCol CellWidth 1
                    
row CellHeight 1
                    (
Col ) * CellWidth, (row ) * CellHeight32+); 


YOffset 25;
XOffset 15;

function 
DrawBartextbarnumbarsyMinyMaxy )
{
 
BarWidth = (Status("pxwidth") - XOffset )/( numbars ); 
 
BarHeight Status("pxheight") - YOffset;
 
relpos = ( Miny ) / (Maxy Miny );

 
xp XOffset + ( bar 0.5 ) * BarWidth;
 
yp YOffset BarHeight * ( relpos );
 
xe XOffset + ( bar ) * BarWidth;
 
ye YOffset BarHeight * ( - ( -miny )/( maxy miny ) );
  
 if( 
)
 {
 
GfxGradientRectxpyp,
                  
xe ye,
                  
ColorHSB70255 relpos255 ), ColorHSB7020255 ) );
 }
 else
 {
 
GfxGradientRectxpye,
                  
xe yp,
                  
ColorHSB020255 ), ColorHSB0255 * ( relpos ), 255 ) );
 }
 
GfxTextOuttextxpye );
 
GfxTextOutStrFormat("%.2f"), xpyp );
}    

function 
DrawLevelsMinyMaxy )
{
  
range Maxy Miny;

  
grid 100;
  if( 
range 10 grid 1;
  else 
  if( 
range 20 grid 2;
  else 
  if( 
range 50 grid 5;
  else 
  if( 
range 100 grid 10;
  else 
  if( 
range 200 grid 20;
  else 
  if( 
range 500 grid 50;

  
_TRACE("grid = "+grid +" range "+range );
  
  
width Status("pxwidth") - XOffset;
  
height Status("pxheight") - YOffset;

  
GfxSelectPencolorBlack1);
  for( 
grid ceilMiny grid ); <= grid floorMaxy grid ); += grid )
  {
    
yp =  YOffset Height * ( -  ( Miny ) / (Maxy Miny ) );

    
GfxMoveToXOffsetyp );
    
GfxLineToXOffset width yp );
    
GfxTextOut""yXOffset widthyp );
  }

  
GfxSelectPencolorBlack1);
  
GfxMoveToXOffsetYOffset );
  
GfxLineToXOffset widthYOffset );
  
GfxLineToXOffset widthYOffset Height );
  
GfxLineToXOffset YOffset Height );
  
GfxLineToXOffset YOffset );
}

MonthNames "Jan,Feb,Mar,Apr,May,Jun,Jul,Aug,Sep,Oct,Nov,Dec";

function 
DisplayProfitTable( )
{
 
Header "Year,"+MonthNames+",Yr Profit%";
 for( 
Col 0; (Colname StrExtractHeaderCol ) ) != ""Col++ )
 {
  
PrintInCellColName0Col );
 }

 
Row 1;
 for( 
FirstYr<= LastYry++ )
 {
  
PrintInCellStrFormat("%g"), Row); 
  
PrintInCellStrFormat("%.1f%%"VarGet("ChgYear" ) ), Row13 ); 
  for( 
1<= 12m++ )
  { 
   
Chg VarGet("ChgMon" "-" m);
   if( 
Chg 
     
PrintInCellStrFormat("%.1f%%"Chg ), Row);
   else
     
PrintInCell"N/A"Row);
  }
  
Row++;
 } 

 
PrintInCell("Mon. Avg"Row);
 for( 
1<= 12m++ )
 { 
   
PrintInCellStrFormat("%.1f%%",  NzVarGet("SumChgMon" m)/VarGet("SumMon" ) ) ), Row);
 }

}

function 
DisplayYearlyProfits()
{
 
Bar 0;
 for( 
FirstYr<= LastYry++ )
 {
   
Chg VarGet("ChgYear" );
   
DrawBar""+yBar++, ( LastYr FirstYr ), ChgMinYrProfitMaxYrProfit );
 }
 
GfxTextOut("Yearly % Profit chart"1010 );

 
DrawLevelsMinYrProfitMaxYrProfit ); 
}

function 
DisplayMonthlyProfits()
{
 
Bar 0;
 
 
MinAvgProf MaxAvgProf 0;
 for( 
1<= 12y++ )
 {
   
Chg VarGet("SumChgMon" ) / VarGet("SumMon" );
   
MinAvgProf MinMinAvgProfChg );
   
MaxAvgProf MaxMaxAvgProfChg );
 }

 for( 
1<= 12y++ )
 {
   
Chg VarGet("SumChgMon" ) / VarGet("SumMon" );
   
DrawBarStrExtract(MonthNamesy-), Bar++, 13ChgMinAvgProf MaxAvgProf );
 }
 
GfxTextOut("Avg. Monthly % Profit chart"1010 );

 
DrawLevelsMinAvgProf MaxAvgProf ); 
}

///////////////////////////
// This function checks if currently selected symbol
// is portfolio equity
//////////////////////////
function CheckSymbol()
{
 if( 
Name() != "~~~EQUITY" )
 {
  
GfxSelectFont"Tahoma"20 ); 
  
GfxSetBkMode);
  
GfxTextOut("For accurate results switch to ~~~EQUITY symbol"1010 );
 }
}

////////////////////////////
// Main program - chart type switch
////////////////////////////
type ParamList("Chart Type""Profit Table|Yearly Profits|Avg. Monthly Profits");

switch( 
type )
{
 case 
"Profit Table"
         
DisplayProfitTable();  
         break;
 case 
"Yearly Profits"
         
DisplayYearlyProfits();
         break;
 case 
"Avg. Monthly Profits"
         
DisplayMonthlyProfits();
         break;
}

CheckSymbol()

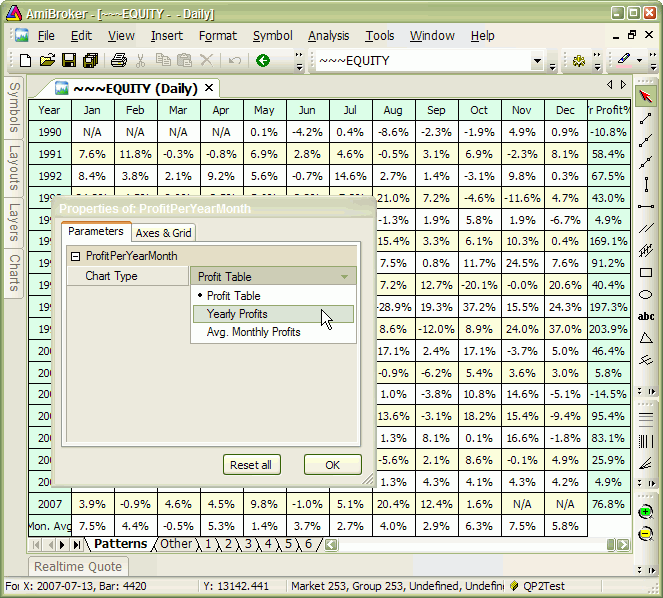
Figure 1. Profit chart in table mode

Profit chart example 2

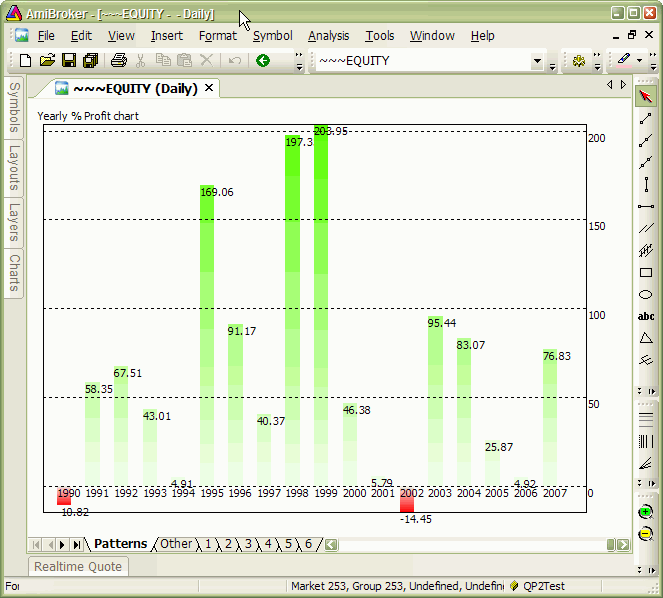
Figure 2. Profit chart in yearly mode

Profit chart example 3

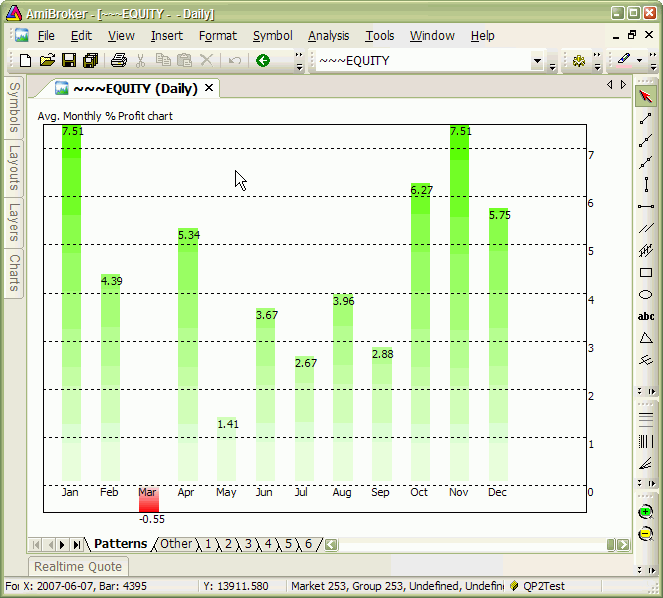
Figure 3. Profit chart in monthly mode

Profit chart example 4

How to display the indicators based on Advances/Declines

IMPORTANT: The article below applies ONLY TO LOCAL DATABASES. If you are using ANY plugin-driven database (eSignal, IQFeed, Premium Data, Norgate, Interactive Brokers or whatever other 3rd party plugin), then you SHOULD NOT use “calculate composites” tool. Instead use composite symbols that are provided by data vendor. Contact data vendor to learn what symbols given data vendor uses, because composite symbols are NOT standarized and vary from vendor to vendor

In order to display indicators based on Advances/Declines first of all it’s necessary to calculate composities in the database:

  1. Open Categories window using Symbol->Categories menu item.
  2. Select base index for given market in Markets tab and Base indexes for – Composites combo.
    For example if you are following NYSE this can by ^DIJ (Dow Jones Average)
    (certain symbol must be marked as index in Symbol -> Information and must belong to the same market)

  3. Choose Symbol ->Calculate composites  menu item to open the window shown below and mark:
    – Number of advancing/declining issues and
    – Apply to: all quotes, All markets

  4. Click Calculate . From now on ADLine, AdvVolume() and TRIN indicators will be visible.

Q: Why does AB need “base index”?
A: Just because it may happen that not all stocks are quoted every businness day and AB needs must calculate number of advancing/declining issues per market. So it checks the “base index” quotations dates and tries to find corresponding quotes of all stocks belonging to that market to find out how many issues advanced, declined and not changed at all.

Q: What are “Volume for base index” and “Copy volume to all indexes” checkboxes for?
A: “Volume for base index” and “Copy volume to all indexes” are provided in case you DON’T have real volume data for index quotes. In that case AmiBroker can calculate volume for index as a sum of volumes of all stocks belonging to given market. First option assigns calculated volume only to “base index”, the second copies the volume figure to all indexes belonging to given market.

How to detect the divergences

There are many different ways to check for divergences. One of the simplest is to use Rate of change indicator and EXPLORATION feature of Automatic Analysis window:

– Analysis -> Formula Editor
– enter:
 
// 5 day rate of change of close
PriceUp ROCC) > ;
// 5 day rate of change of MACD histogram
MacdUP ROCMACD() - Signal(), ) > 0;
BullishDiv NOT PriceUP AND MACDUp;
BearishDiv PriceUP AND NOT MACDUp;
Filter BullishDiv OR BearishDiv;
AddColumnBullishDiv"Bullish Divergence"1.0,
       
colorDefaultIIf(BullishDivcolorGreencolorDefault ) ); 
AddColumn
BearishDiv "Bearish Divergence"1.0,
       
colorDefaultIIf(BearishDiv colorRedcolorDefault) )

– Tools -> Send to Auto-analysis
– Apply to: All Symbols, N last quotations = 1
– press EXPLORE

Tools -> Send to Auto-analysis- Apply to: All Symbols, N last quotations = 1- press EXPLORE

A different approach can use linear regression instead:
 
// 10 day linear regression slope of close
PriceUp LinRegSlopeC10 ) > ;
// 10 day linear regression slope of MACD histogram
MacdUP LinRegSlopeMACD() - Signal(), 10 ); 


How to detect the study crossover for multiple symbols with use of SCAN

It’s possible to use Automatic Analysis window to search for trendline (or other study) crossovers for multiple symbols at once. It’s necessary to do the following:

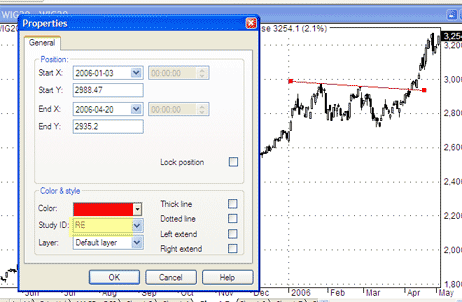
1. Draw trendlines on the chart and assidn them a STUDY ID – two letter code that allows to recognise the particular study. To do this, go to study properties (Alt+Enter) after you draw the line (in this example – StudyID = “RE”).

study1.gif

2. Repeat the process for other symbols (remember to draw the trendlines in the same chart pane).

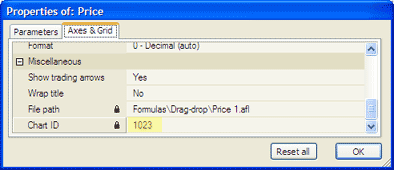
3. Check the CHART ID (in order to call this particular chart pane from the SCAN). To check the ChartID – click on the chart with right mouse button, go to: PARAMETERS -> Axes&Grid (in this example – CHARTID = 1023).

study2.gif

4. Now we can write the formula:
– Analysis -> Formula Editor
– enter:

Buy = Cross( Close, Study(“RE”, 1023) );

(note that we use the same StudyID and ChartID in the formula)
– Tools -> Send to analysis.
– Apply To: All Symbols, All Quotations
– press SCAN

How to chart spreads?

To create a spread chart (and other multi-security indicators / statistics etc.) one can use FOREIGN function which allows to refer to other symbols than currently selected:

It’s necessary to do the following:
– Analysis -> Formula Editor
– enter the formula:


spread Foreign"ticker1""C") - Foreign"ticker2""C");
Plotspread"spread"colorRed); 

– Tools -> Apply Indicator
(replace ticker1, ticker2 with actual symbol names)

How to plot a trailing stop in the Price chart

In this short article we will show how to calculate and plot trailing stop using two different methods. (more…)

How to fill the area between two lines with a solid color

This example shows how to fill the area between Bollinger Bands with a solid color. (more…)

« Previous PageNext Page »