September 17, 2014
How to display Bond and Bill prices in fractions
Treasury Bond and Bill futures are traded in fractions, not decimals. A typical bond quote may be 124’21 which means 124 and 21/32nds, so one needs special method to display prices in non-decimal format.
To achieve desired result we need to do two things.
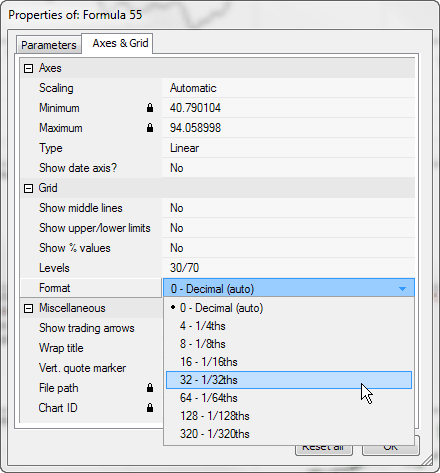
1. Switch Y axis grid to desired fraction format. To make a change, right click on the chart and select Parameters, then switch to Axes & Grid tab and change Grid Format as shown below:

2. Create a price chart with custom title showing fractions instead of decimals. Go to Analysis->Formula Editor, enter the following formula and press Apply Indicator toolbar button.
function NumToFrac( num )
{
  return StrFormat("%.0f'%0.f", floor( num ), frac( num ) * 320 );
}
Plot( Close, "Close", colorDefault, styleCandle);
Title = "{{NAME}} - {{INTERVAL}} {{DATE}} Close: " + NumToFrac( Close )
The NumToFrac function formats decimal value into full points and 1/320nds fraction of the full point.
 Filed by Tomasz Janeczko at 5:44 am under Charting
Comments Off on How to display Bond and Bill prices in fractions